There is a lot of talk around data science, analytics and visualization today. Big data, machine learning and artificial intelligence are changing the way we understand and influence the surrounding environment and society through analysis and manipulation of fluxes of data.
We request for fresh data on a regular basis, from our colleagues, our bosses, our clients, institutions and online public sources such as open data ones. We want them to be clean, reliable, and accessible to extract useful information and knowledge in an easy and shareable way but:
There are great statistics and data science books around, and I referenced few of them at the end of this article. Here instead I will try to expose the benefits of undertaking a structured "Data and Decisions" approach like we did during the course modules, filtered through the eyes of my previous postgraduate research in Statistics, the data science courses I undertook at HarvardX and IBMx, and my professional experience in information management and R programming.
While Webster's Third New International Dictionary defined Statistics as a science dealing with the collection, analysis, interpretation, and preparation of numerical data, today we have to take into consideration also the technologies that allow us to work with it.
Our productivity tools of choice such as programming languages, compilers, code repositories, software, databases and data warehouses, CI/CD and cloud infrastructures, are our best allies in obtaining the results we look for.
Descriptive statistics in business analysis use data gathered on one or more groups to describe and reach conclusions about that same groups, to explore the dataset available and report its parameters. Statistical parameters such as: mean, median, mode, range, quantiles, standard deviation, variance.
Inferential statistics gathers data from samples and uses the statistics to reach conclusions about the population from which the sample was taken. making data-driven decisions.
We request for fresh data on a regular basis, from our colleagues, our bosses, our clients, institutions and online public sources such as open data ones. We want them to be clean, reliable, and accessible to extract useful information and knowledge in an easy and shareable way but:
- Do we really know what are the relevant data we need?
- Do we always extract knowledge from them?
- Are we really able to take informed decisions based on them?
- Do we really know how to deal with information overflow?
- Do we know how to avoid misinterpreting data with the risk of taking wrong decisions?
What I have found in the Data and Decision box
Data modelling and analysis activity requires clear understanding of the business problem to solve, understanding of data, methodical preparation, the ability to define the goal and priorities of the research, identify key messages and key audiences:- What are Statistical techniques useful for in a business context?
- In a fast paced, results oriented environment, what are the real challenges and mistakes people repeatedly make when approaching data and decisions problems, and how to avoid them?
- Is there any standard approach that could help us understand whether we are working towards the right directions?
While Webster's Third New International Dictionary defined Statistics as a science dealing with the collection, analysis, interpretation, and preparation of numerical data, today we have to take into consideration also the technologies that allow us to work with it.
Our productivity tools of choice such as programming languages, compilers, code repositories, software, databases and data warehouses, CI/CD and cloud infrastructures, are our best allies in obtaining the results we look for.
Descriptive statistics in business analysis use data gathered on one or more groups to describe and reach conclusions about that same groups, to explore the dataset available and report its parameters. Statistical parameters such as: mean, median, mode, range, quantiles, standard deviation, variance.
Inferential statistics gathers data from samples and uses the statistics to reach conclusions about the population from which the sample was taken. making data-driven decisions.
Descriptive measures of populations are called a parameters, descriptive measures of samples are called statistics.
The most common statistic techniques are:
To obtain an output fulfilling the original purpose of a data request, we have to be careful in doing the following things upfront:
- Visualizing and describing data, like summarize and visualize data sets with descriptive statistics, measures of variability and central tendencies, boxplots, and histograms.
- Probability: symbols, rules, events, discrete and continuous distributions
- Sampling tehniques, making inferences, estimating parameters and testing hypotheses
- Analysis of variance (ANOVA)
- Regression analysis and forecasting through regression analysis and correlation, including quantify the strength and relationships between independent and dependent variables
- Non-parametric statistics (Chi-Square Goodness-of-Fit test and test of independence), Mann-Whitney test, Wilcoxon test, Kruskal-Wallis, Friedman test, Spearman's Rank Correlation.
- Operations management, process improvement and quality control (Six Sigma, Lean manufacturing, Pareto analysis)
- Executive decision analysis
- Marketing and Sales
- Human Resources
- Policy making
- Cybersecurity
- Product and Service Design
- Customer Service and support areas
- Service management and IT operations
- Supply Chain
- Policies
to name just few of them.
Interesting enough, especially for IT and Telecommunications related KPIs, benchmarks and best practices, we are not let alone and we can find support through well established frameworks such as ITIL and COBIT, to not to reinvent the wheel.
When data is not just about numbers
Despite it is slightly out of the scope of this article, it is important to remember that today data analysis goes beyond traditional quantitative and categorical data, but it involves text mining and spatial data as well. From search engines to social media, from geolocalization to smart cities, analysis and evaluation of this kind of data must be taken into consideration within the broader scope of business analytics competencies.How I consider Data and Decision training useful
The use of statistical models and data science techniques for decision making cannot be improvised. It is not just a matter of dropping a couple of reports with fancy graphs, it requires the involvement of people with solid skills and knowledge instead:- Understanding of the business AND the business problem to analyse
- Understanding of which data analysis technique and algorithms to apply
- Having familiarity with data analysis tools and, eventually, programming languages such as R or Python
- Having knowledge of data structures and data storage / warehousing techniques
- Take the time to understand the request for data and analysis.
- Organize the information in a way that makes sense.
- Select the type of analysis based on the question received.
- Decide on the format of the final output such as single graph, dashboard or a narrative / story.
- Introducing the context, the problem to solve and the proposed solution
- Business model overview underlying the research and the problem to solve
- Data understanding and preparation, providing an overview of the structure of data and its description
- Exploring data through segmentation, scoping, graphical representation and descriptive analysis. Search for categories, metrics, and filters, then organize your fields by type (categories, metrics, or filters) and document them in a list
- Model proposal, going deeper into the analysis of data by analysing specific segments, providing a model of analysis, correlating variables and offering information for further research and segmentation
- Drawing conclusions from the hard work we have done so far
... and then start again. I still use it today and I consider it a strong asset in my approach to data analysis challenges.
Evaluate the data model and business life cycle analytics
A CRISP-like Data Model could facilitate our work providing a structured data life-cycle approach. It is based around recursive exploration, focusing on approaches and strategy rather than software design.
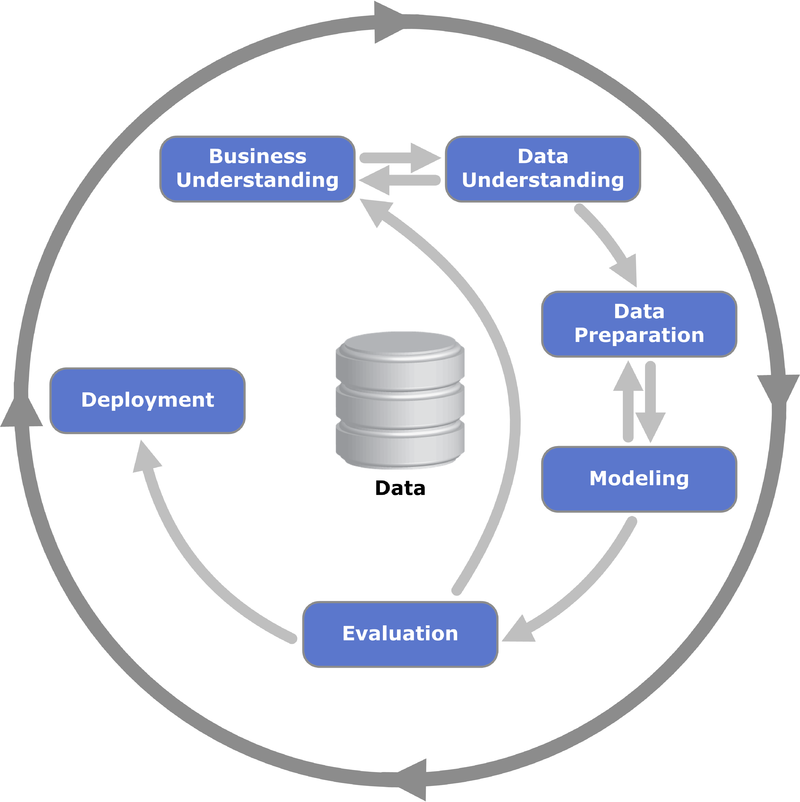 |
| CRISP model - Source: Wikipedia |
By following this model as a repeatable process, we try to understand and prepare data, then model and evaluate results based on the necessary techniques available. Certain steps, like data understanding and preparation, might require several iterations to get a dataset ready for modelling and clean from outliers and misleading information.
The fundamental concepts of a data analysis activity should determine the proper methods for gathering the data behind a data-driven decision and identify common data-gathering errors to avoid:
The fundamental concepts of a data analysis activity should determine the proper methods for gathering the data behind a data-driven decision and identify common data-gathering errors to avoid:
- To define and apply a process, from analyzing and extracting useful knowledge from data to solve the business problems by treating the information systematically, by following defined stages and decomposing a business problem into sub tasks;
- To automate descriptive analysis of a large mass of data by using information technology and find informative descriptive attributes of entities of interest;
- Fitting the context by formulating data mining solutions and results by thinking about the environment in which they will be used;
- Using common data mining techniques, trying to generalize beyond the data provided with the aim to avoid overfitting while avoiding oversmoothing.
Data Understanding and Preparation
The data preparation phase proceeds along with data understanding through two or more iterations during which:
- The population is analysed, its characters and variables are defined, and eventually sampled
- Features of interest from statistical units of the population are defined from the raw data
- Data is manipulated and converted into forms that return better results. Such activity includes managing missing and null values, handling duplicates and junk values, eventually aggregating data to better manipulate it
- A strategy to recognize and manage outliers and exceptions is defined
- Raw data is summarized and made interpretable
Exploring Data
The aim of this step is to collect general information and trends related to the data set with minimal segmentation of data. It
aims at discovering population’s groups that differ from each other with
respect to some quantity of interest.
Descriptive statistics, graphs, tables summarize data providing useful information and important insights about the variables of
interest, how they correlate, whether normalization is needed, and then we try to interpret the results to determine whether the data set can answer the problem to solve.
We also try to define a model of analysis focused on segmentation to determine the distribution of the data set. A similar approach can be used when approaching other main segmentation categories in our research.
The time series has to be analysed with appropriate representation for time phased graphs.
Modelling techniques, Inferential Analytics and Evaluation
Based on the data types, requirements, classification or regression problem to solve, it is necessary to choose the type of predictive techniques, predicted vs predictor variables, supervised / unsupervised machine-learning approaches. This is again an iterative and time consuming approach aiming at understanding what is the model that best works among the ones that perform better.
Regression models can help us understand how changes of predictors affect the variable we try to predict, e.g.: 1 euro / dollar increase in salad price vs. number of order drops.
Machine learning (ML) techniques on the other hand delegate learning tasks based on historical data to computers, building models through iterative learning to find hidden insights, and be able to adapt to changes in data. They are divided in supervised and unsupervised ML models depending on the availability of training sets and data types.
The evaluation of a model involves several activities such as:
- Sub-setting into training, test and validation data partitions to train the model, assess performance and fine tune to avoid overfitting;
- Cross validation, such as k-fold one to achieve unbiaed performance estimate in case of limited amount of data;
- Classification model evaluation through Confusion matrix, Lift chart and ROC chart
- Regression model evaluation such as Root-Mean-Square Error
Deployment and Representation
Within the high-tech world that surround us, the deployment phase is a critical one. Based on the business objective and deployment scenario, the model could e a predictive analytics or a simple report, it could also be presented differently through different media. We have to take into consideration the following variables:
- Hardware sizing to ensure performance
- Software capabilities and integration
- End-user interaction with reports, dashboards, views
- User training and skills to interact with the model
All our efforts would be useless if nobody can receive the results of our research in strctured, readable and easy to understand format. Further to the approach proposed above, beter to make sure that our report includes the following topics:
- Problem description
- Data sets used (or at least a detailed description)
- Data cleaning operations carried out on the set
- method, techniques and algorythms used to create the model
- Deployment requisites, including technology requirements, interaction and usage
- Issues handling, such as report, analyze and address tehe issues observed.
After the consolidation of the model and all the technicalities sorted, visualization and representation of data to fit our audience is essential to convey the message we want to support and help our target to easily understand the results of the analysis. Formulating a brief, having a structured and consstent editorial approach for:
- Data representation and visual enconding
- Notes and captions
- Colours (e.g.: context, color-blindness, etc)
- Interaction with data and data representation
- Composition such as layouting and hierarchy
Confounding, Spurious Correlation and Decisions: Correlation is not Causation
Confounding causes misleading information, taking us to misinterpreting associations and therefore causing damaging decisions and risk of business disruption. Even if data provides strong evidence of correlation between variables, this does not mean that one is causing the other, so it is important to find ways to identify spurious correlation and explain how data dredging can lead to spurious correlation: there are many reasons that a variable x can correlate with a variable y, without either being a cause for the other.
The cases presented in the Spurious Correlations site are examples of general data dredging, or data phishing, or data snooping: a form of what is called call "cherry picking".
An example would be looking through many results produced by a random process, and pick the one that shows a relationship that supports the theory you want to support. This particular form of data dredging is referred to as P-hacking.
An example would be looking through many results produced by a random process, and pick the one that shows a relationship that supports the theory you want to support. This particular form of data dredging is referred to as P-hacking.
Another example would be to reward statistically significant results over negative results, when there is an incentive to report significant results. In social sciences for example, it would be looking for associations between an average outcome and several exposures, and report only the exposure that resulted in a small p-value. They might also try fitting different models to adjust for confounding and pick the one model that yields the smallest p-value. In experimental disciplines, an experiment might be repeated multiple times, and only the experiment resulting in a small p-value is reported.
Confounders are perhaps the most common reason that leads to associations being misinterpreted. If X and Y are correlated, we call Z a confounder if changes in Z cause changes in both X and Y.
Another critical issue with correlation is the impact that outliers have on it. So instead of using simple correlation in presence of outliers, an alternative way for estimating the population correlation that is robust to them is called Spearman correlation: it computes the correlation on the ranks of the values, rather than the values themselves.
A further interesting phenomenon to take into consideration when analysing correlation is the Simpson's Paradox: a statistical phenomenon in which a trend appears in different groups of data but disappears or reverses when these groups are combined, causing to prove opposite arguments by using the same data. It is called a paradox because we see the sign of correlation flip when we compute on the entire population and when we compute on specific data strata.
Here are some useful resources to go deeper into it:
An example of Simpson's paradox could be the following: if we suppose to have three variables x, y, and z, with x and y negatively correlated, and once we stratify by z (a confounder which we have not looked at) we see a different pattern to emerge when computing the correlation in each strata, with correlations now positive, we understand that it is z that is negatively correlated with x. If we
stratify by z, the x and y are actually positively correlated.
Takeaways
The module was tough, we had a huge amount of content to manage in a short amount of time.
What I enjoyed the most was to take Statistics and programming from a new point of view:
- by applying theory to real life problems and then pass through the whole process of business value creation.
- Having a practical approach towards solving business problems: data activities has to be driven by clear business needs and support decision making.
- Have and maintain a structured approach to data management and analysis
- Leave the right-the-first-time approach and move towards a recursive and more agile analytical approach
Useful Resources
- https://blog.rstudio.com/
- https://www.r-bloggers.com/
- https://rweekly.org/
- https://towardsdatascience.com/
- https://www.tableau.com/about/blog
- https://aws.amazon.com/blogs/machine-learning/
- https://cognitiveclass.ai/courses/data-science-101
- https://simplystatistics.org/
Bibliography and References
- Data and Decisions course, Executive MBA, Quantic School of Business and Technology, 2020
- Provost F., Fawcett T., Data Science for Business: What you need to know about data mining and data-analytic thinking, Sebastopol (CA), O'Reilly Media, 2013
- Black K., Applied Business Statistics: Making Better Business Decisions, 7th Edition, John Wiley & Sons, 2013
- Williams G., Data Mining With Rattle and R: The Art of Excavating Data for Knowledge Discovery, New York, Springer-Verlag; 2011
- I. H. Witten, E. Frank, M A. Hall, Data Mining - Practical Machine Learning Tools and Techniques, 3rd Edition, Burlington (MA), 2011
- Hodegatta, Najak, Business Analytics Using R - A Practical Approach, Apresse, Bangalore, 2017
- C. Wong, Security Metrics - A beginners guide, McGraw-Hill, 2012
- Andy Kirk, Data Visualisation - A Handbook for Data Driven Design, SAGE, Glasgow, 2016
- Rafael A. Irizarry, Introduction to Data Science, 2020-05-10
- Sam Priddy, How to accurately translate analytics requests into dashboards, sheets, stories and more, Tableau blog
Comments
Post a Comment